Interactive simulation
Bode plot simulation
Gain against frequency on a log axis — where a filter actually stops working.
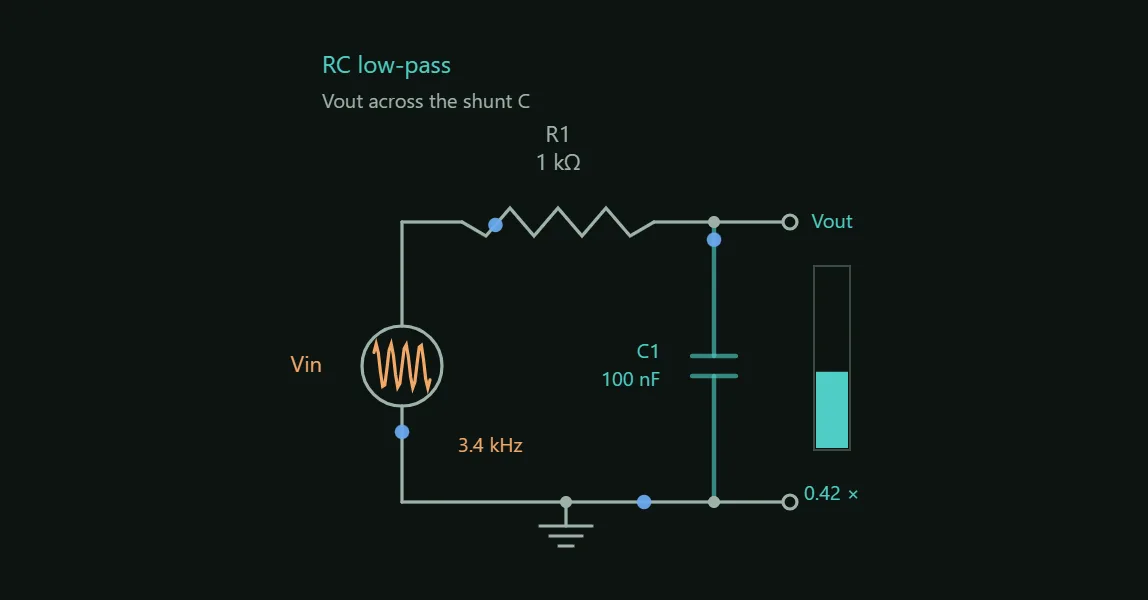
The orange probe walks the curve from 10 Hz to 1 MHz over and over: watch the source's sine tighten up and the Vout bar collapse as the gain leaves the passband. L only bites in the RLC mode — the two RC filters ignore that slider completely.
What you can change
- R
- C
- L (RLC only)